


Every day, companies’ needs to improve the methods for processing and collecting information, as well as the mechanisms for storing and analyzing data on their activities and operations, are becoming more demanding. What companies want is for these actions to help optimize the performance of each of their areas, and these are the goals of the research and innovation department. It is from this need to control how information is visualized and to make decisions based on strategic data that, for some years now, the term business intelligence has been heard very frequently, and for companies it has already become an established need.
At Creangel, we stand out for creating tools based on companies’ real needs and for disruptive optimizations based on the most advanced technology. Our more than 18 years of experience give us a strategic perspective whose sole aim is to deliver to companies everything they need to create an integrated view of the business and, in a simple and user-friendly way, support decision-making. To achieve this, we focus on changing the way things are done and on improving processes.
To understand the impact of the Lakehouse on our day-to-day work, I will explain in simple terms how it works and how it improves the quality of Analytics processes, and therefore all business intelligence (BI) activities, using the tool designed by Creangel.
Every information analysis process starts from one or more information sources, from which raw data on the company’s activity is collected. The data is processed and stored in data warehouses. Once stored, users can access the data, which starts the analysis process to answer business questions. In most companies, this information is part of their transactional system, and the performance of these systems must be protected so that search activity does not slow down these tools, which are essential for running the company’s core operations.
Here, traditional analytics systems have two options. The first is to protect the performance of the company’s transactional tools: they capture the information at various points in time and, from that information (which, it is worth noting, will never be truly up to date), they preview some tables that analysts can use, knowing that these information requests can take hours or even days to be delivered. The other option is not to take all the information but only a sample of it (a piece), and if companies want real-time information, it will always impact the transactional system, slowing down the company’s daily operations.
In addition, traditional data visualization options for analytics are neither designed nor prepared for huge volumes of information, which in turn creates the need to split the information in order to handle it and to repeat the process several times. This is the complete opposite of process optimization, which is precisely the goal that leads companies to turn to business intelligence. In other words, what companies currently use to visualize information and make decisions that optimize and improve their processes needs to be improved, because it is based on repetitive actions and rework.
This is where Creangel saw the need to design a tool capable of handling large volumes of information, in real time, with all the data (not just a piece of it), without impacting the transactional system and, last but not least, accessible in terms of operations and costs.
This is how our tool works. To begin with, IFINDIT for Analytics runs on a type of database that keeps a history of the state of the different sensors and measurements over time; time and the nature of time in each piece of data are essential for us to do our job well, since it is based on a Lakehouse, a high-performance real-time analytics database where search starts from these measurements. What makes our tool innovative and unconventional, and what truly makes the difference, is based on the following 3 components:
The first is coordinated processing, which refers to having different independent stores (nodes). The tool can work with as many stores as it needs depending on the size of the information, whereas traditional tools do so with only one store. For example, it has a master store that controls all actions toward the server, stores that distribute queries, and data stores, and it is able to create as many stores as necessary, thousands of individual stores if needed, to answer queries in record time. In other words, if we apply this way of working to a coffee plantation, one picker does not produce the same result as 200 pickers doing the same task at the same time. At the end of the day, the 200 pickers will have brought far more coffee to the mill than a single picker, who would also take much longer to harvest the entire crop. This also allows a larger number of users to run searches, because the search is performed horizontally across all stores rather than vertically through a single store. It also affects cost: compared with traditional tools, our tool is much more affordable because pricing is not based on the number of searches or users; you can search millions of times and have users everywhere, and the price will be the same.
The second is the hybrid architecture, which means that we have local components and separate storage; this is basically storage and processing kept apart. Here we can use deep storage to redistribute the workload so that it does not collapse. The stores we mentioned earlier (nodes) have workloads distributed automatically, which means there is no downtime or idle time in activities and no manual work, one of the least-liked features of the competition’s traditional tools. An everyday example is the purpose of a queue ticket system like the ones companies use in customer service: users arrive, take a ticket and are assigned to an agent, which ensures that agents serve people in order of arrival, according to their needs and in the shortest possible time, optimizing the agents’ time in an organized way. This is what the hybrid architecture of the IFINDIT for Analytics tool guarantees.
And the third is an efficient storage engine. Storage engines are a group of functions closely related to the stored database. This engine is similar to hidden software between the layers of our tool’s stores (nodes) and is used to create, update, edit, view or delete data. If we picture our stores as your city’s library, the efficient storage engine is the librarian who keeps the entire catalog up to date, makes updates, removes what is no longer useful, adds new books and lets you view them. As you can see, having an efficient storage engine is essential within Creangel’s analytics tool.
To conclude with the features of the analytics tool, there is no option on the market that is more user-friendly, faster to implement and easier to adapt than IFindIT for interactive Dashboards. While with the competition’s traditional tools your developers must be coding experts and learn millions more lines to adapt them to everyday use, our tool is delivered fully usable: no more code, we do it for you.
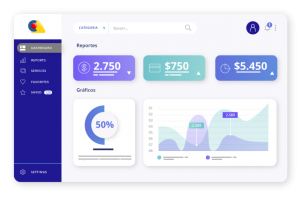
That covers architecture and technology. If we look at results, speed and price, we can say that Creangel’s IFindIT tool delivers 3 times more than traditional tools, answers queries 14.3 times faster and can complete operations in a third of the time. And when it comes to price, performance and benefits, the IFINDIT for Analytics tool was created with the Colombian and Latin American market in mind.
Competitors that sell traditional tools bill per query, per search and per user, which makes it very difficult to estimate the real cost of the tool in the medium and long term, and even in the short term, since costs can rise sharply and exponentially as soon as the company uses the tool and runs more searches every day, in addition to consulting and training on how to use the tool. In contrast, Creangel’s analytics tool is billed by blocks and ranges of information, so from day one you know the cost of the tool, with no add-ons or surprise expenses. This means you can run every search you can imagine, from every user who needs it. We have come across companies in the market that contracted the competition’s traditional tools and started with a moderate cost in the first month, covering just 10% of the users and searches needed, and by the third month had to suspend the pilot because it exceeded the initial cost 100 times, without even managing to support the company’s full real needs. If we compare the real cost of our tool with the use of traditional tools, the latter can be 4 times higher, on top of the volatility of the dollar exchange rate and additional implementation costs.
There are many information sources and systems that companies need to take into account, but they cannot spend months on an invasive implementation at incalculable cost. For companies, investing in accurate information visualization for analytics should translate into:
- Cost and time savings that increase the company’s productivity
- Meeting efficiency goals.
- Discovering new business and growth opportunities.
- Understanding current customers’ needs and improving user-facing services.
- Promoting proper knowledge management within departments by graphically displaying data that might otherwise go unnoticed
- Truly making decisions backed by reliable, up-to-date and complete information
Not one more headache. In conclusion, the operational and cost advantages of a tool fully tailored to the local market, 100% developed by Colombians, are the answer to companies’ needs and to their constant quest to stay at the forefront. The goal is to ensure that the tools used to optimize processes do not become obsolete, avoiding setbacks, and permanently transforming the way information is accessed and visualized and how it contributes to decision-making. The answer is Creangel’s IFindIT interactive Dashboards.
Author: Creangel